|
  |
| |
| Price Changes Past 30 Days
$10 Gold Indians - 1911
| FMV Prices (Good-MS70)
| Grade
| Current Price
| Old Price
30 Days
| % Change
| | 1911 | G4 |  1,350 1,350 | 1,210 | 11.57% |
| Price Changes Year to Date
$10 Gold Indians - 1911
| FMV Prices (Good-MS70)
| Grade
| Current Price
| Old Price
Jan. 1
| % Change
| | 1911 | G4 | 1,350 | 1,040 | 29.81% |
| |
|
|
|
|
| | 1911 | VG8 | 1,360 | 1,160 | 17.24% |
|
|
|
|
|
| | 1911 | F12 | 1,390 | 1,260 | 10.32% |
|
|
|
|
|
| | 1911 | F12 | 1,390 | 1,260 | 10.32% |
|
|
|
|
|
| | 1911 | VF20 | 1,410 | 1,290 | 9.30% |
|
|
|
|
|
| | 1911 | VF20 | 1,410 | 1,290 | 9.30% |
|
|
|
|
|
| | 1911 | XF40 | 1,440 | 1,310 | 9.92% |
|
|
|
|
|
| | 1911 | XF40 | 1,440 | 1,330 | 8.27% |
|
|
|
|
|
| | 1911 | AU50 | 1,450 | 1,320 | 9.85% |
|
|
|
|
|
| | 1911 | AU50 | 1,450 | 1,330 | 9.02% |
|
|
|
|
|
| | 1911 | AU53 | 1,460 | 1,320 | 10.61% |
|
|
|
|
|
| | 1911 | AU53 | 1,460 | 1,340 | 8.96% |
|
|
|
|
|
| | 1911 | AU55 | 1,480 | 1,390 | 6.47% |
|
|
|
|
|
| | 1911 | AU55 | 1,480 | 1,420 | 4.23% |
|
|
|
|
|
| | 1911 | AU58 | 1,490 | 1,450 | 2.76% |
|
|
|
|
|
| | 1911 | AU58 | 1,490 | 1,440 | 3.47% |
|
|
|
|
|
| | 1911 | MS60 | 1,540 | 1,500 | 2.67% |
|
|
|
|
|
| | 1911 | MS60 | 1,540 | 1,530 | 0.65% |
| |
|
|
|
|
| | 1911 | MS61 |  1,560 1,560 | 1,590 | -1.89% |
| |
|
|
|
|
| | 1911 | MS62 | 1,690 | 1,720 | -1.74% |
|
|
|
|
|
| | 1911 | MS63 | 2,060 | 2,030 | 1.48% |
|
|
|
|
|
| | 1911 | MS63 | 2,060 | 2,030 | 1.48% |
| |
|
|
|
|
| | 1911 | MS64 | 2,940 | 2,810 | 4.63% |
|
|
|
|
|
| | 1911 | MS65 | 8,220 | 8,130 | 1.11% |
|
|
|
|
|
| | 1911 | MS65 | 8,220 | 8,290 | -0.84% |
|
|
|
|
|
| | 1911 | MS66 | 17,360 | 17,360 |  0.00% 0.00% |
|
|
|
|
|
| | 1911 | MS66 | 17,360 | 17,230 | 0.75% |
|
|
|
|
|
| | 1911 | MS67 | 55,580 | 55,580 | 0.00% |
|
|
|
|
|
| | 1911 | MS67 | 55,580 | 55,580 | 0.00% |
|
|
|
|
|
| | 1911 | MS68 | 105,950 | 105,950 | 0.00% |
|
|
|
|
|
| | 1911 | MS68 | 105,950 | 105,950 | 0.00% |
| | | | |
|
|
|
|
|
|
|
|
|
|
|
|
|
NumisMedia Member
Specialists
 Authorized
rare coin dealer members specializing in
|

$10 Gold Indians
|
|
|
|
|
|
|
GREEN arrows (price increase) and RED arrows (price decrease) track the most recent price changes.
Analyze historical pricing trends and compare adjacent grades; graphs for current and past FMV, Plus and CAC prices can be accessed by clicking a price within the price charts.
Price changes and comparisons for FMV, Plus and CAC prices, for the past month and year to date, can be accessed by clicking a date/type within the price charts.
Select 'No Frames' to view our printer friendly version.
|
|
|
|
|
|
  |
|
|


 Previous
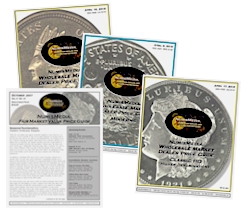
 FMV Price Changes
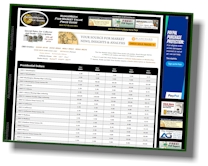


![[Most Recent Quotes from www.kitco.com]](http://www.kitconet.com/charts/metals/gold/t24_au_en_usoz_2.gif)
![[Most Recent Quotes from www.kitco.com]](http://www.kitconet.com/charts/metals/silver/t24_ag_en_usoz_2.gif)